Manaus, 10 de outubro de 2022
ANÁLISE CARTOGRÁFICA
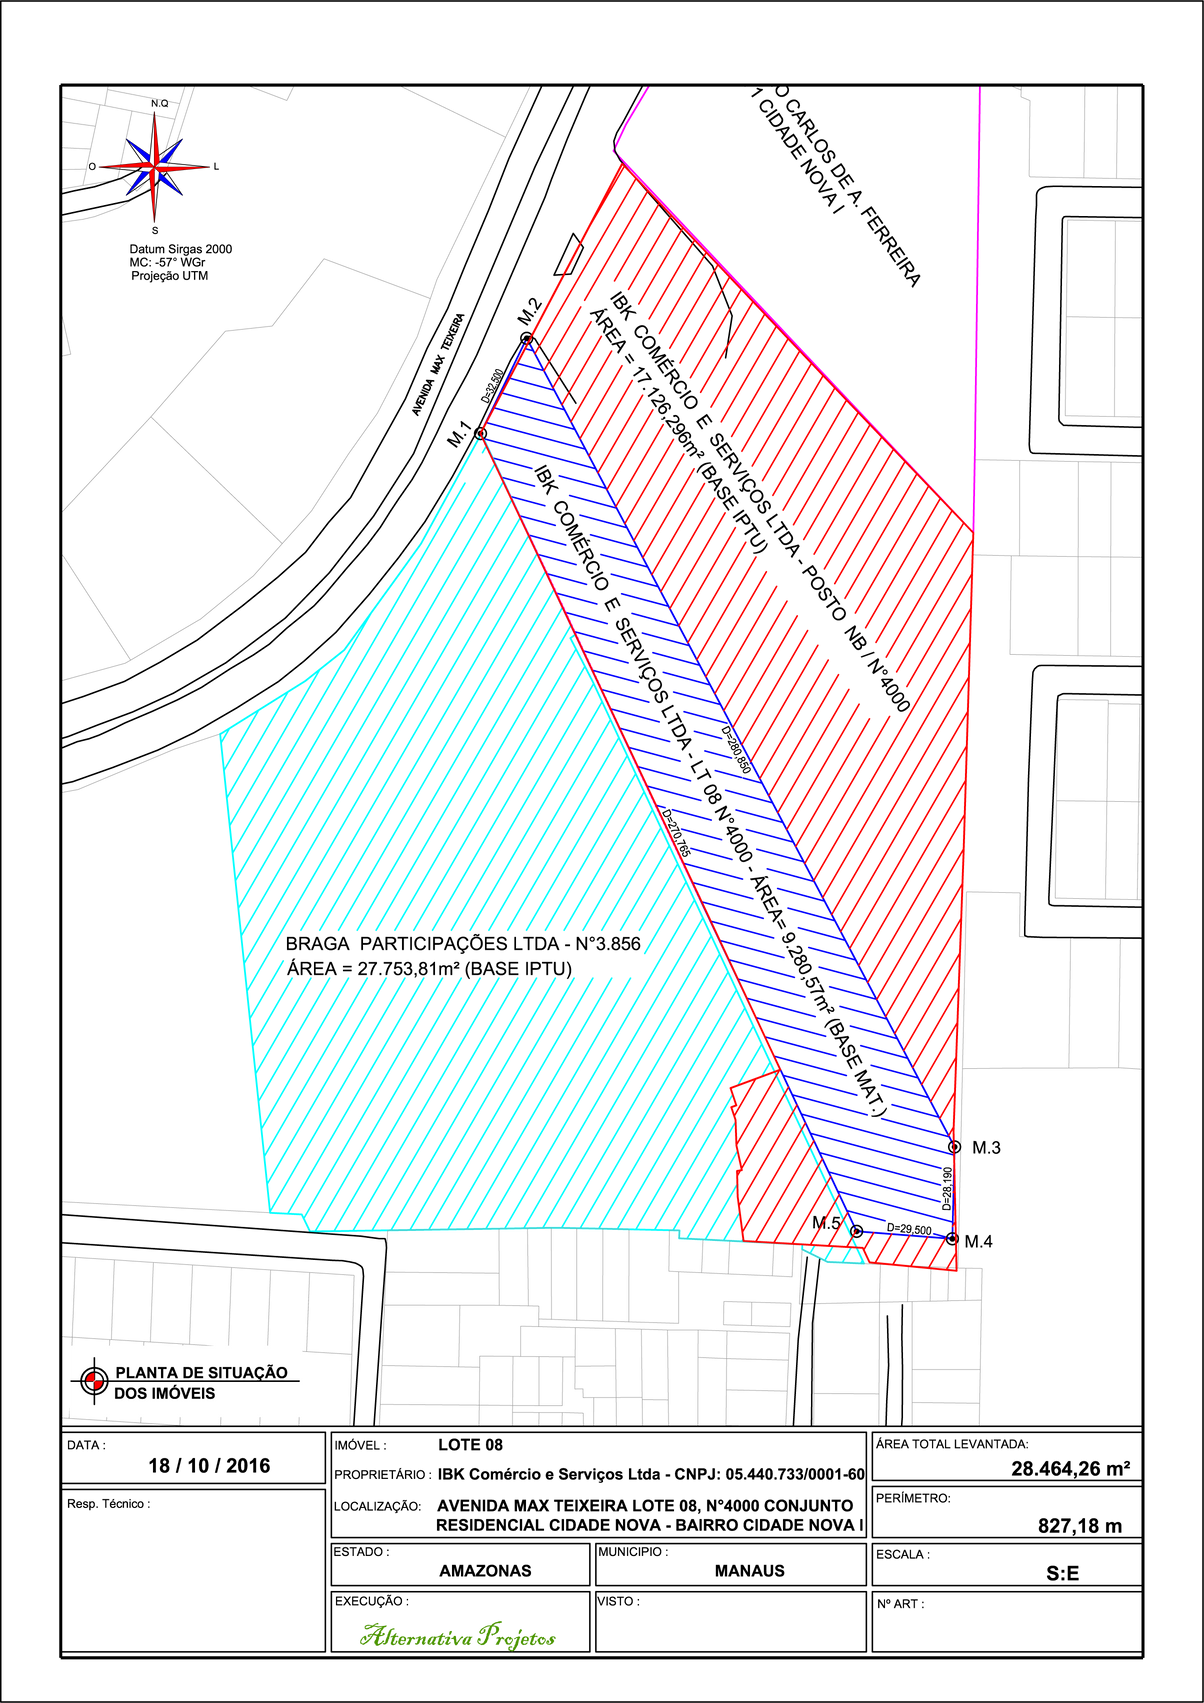
Reconstituição cartográfica, georreferenciamento e unificação de quatro lotes urbanos, localizados na Av. Max. Teixeira - Bairro Cidade Nova.
Imagem 01 - em 360 graus interativa

Imagem 03 - em 360 graus interativa
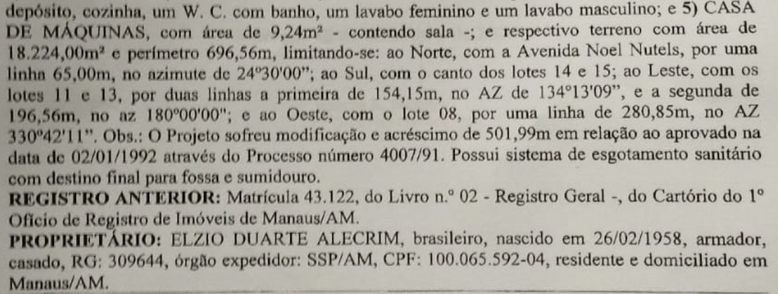
DADOS PREEXISTENTES - 01
DADOS PREEXISTENTES - 02
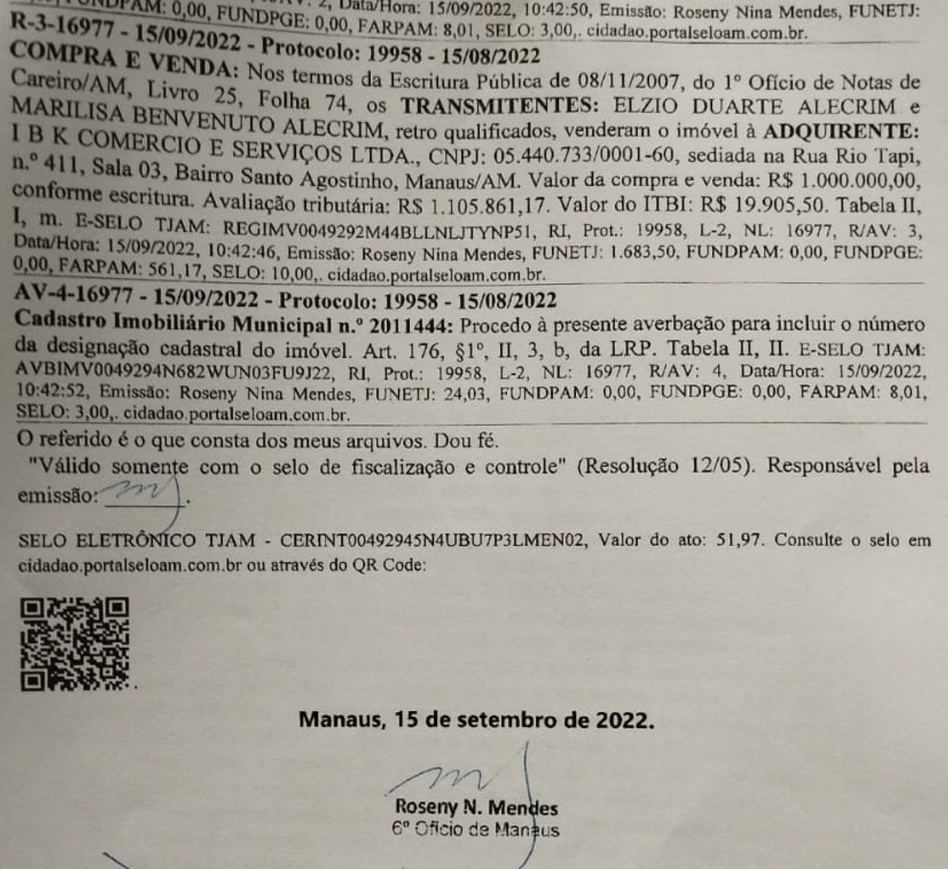
Registro Cartorário
Imóvel: Matrícula: 16.977
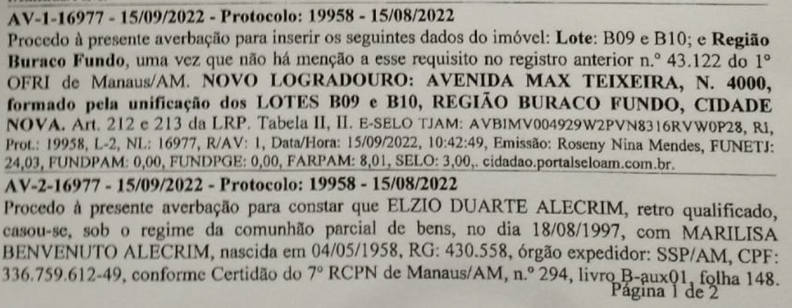
DADOS PREEXISTENTES - 02
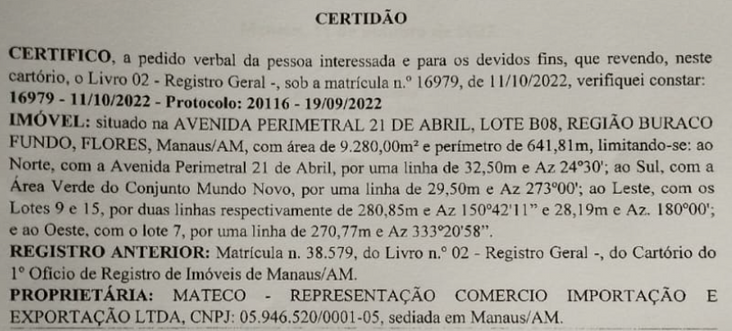
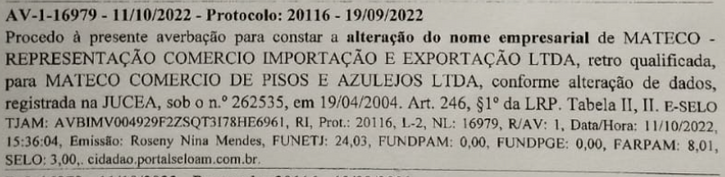
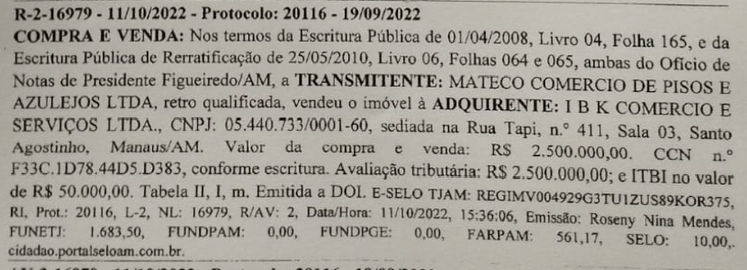
Registro Cartorário
Imóvel: Matrícula: 16.979
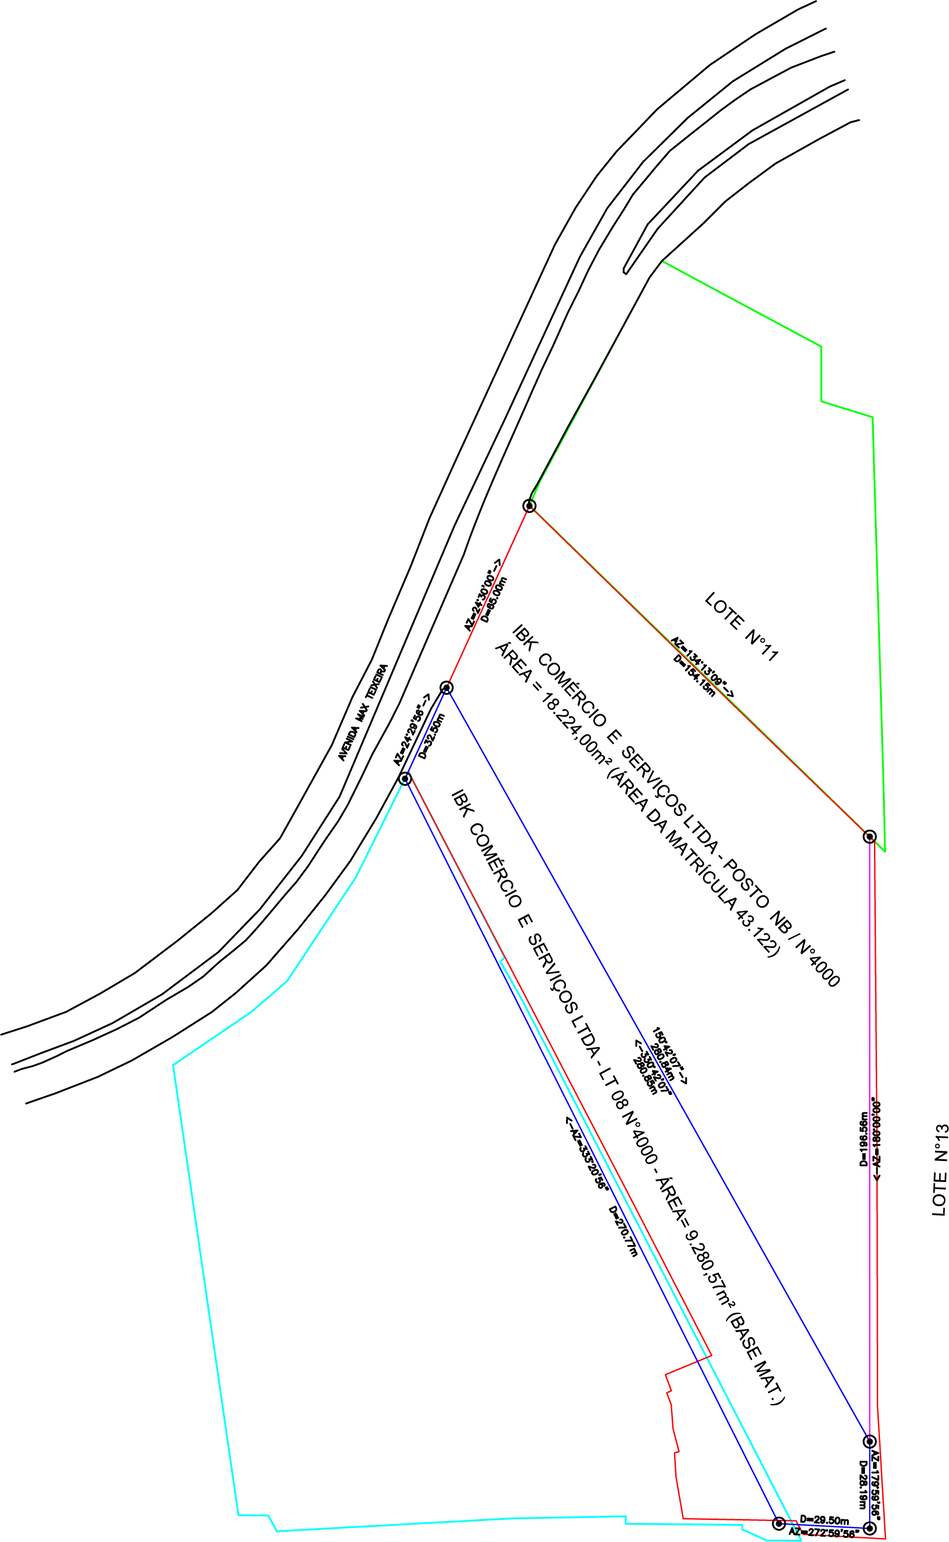
RECONSTITUIÇÃO E GEORREFERENCIAMENTO
UNIFICAÇÃO DOS LOTES
Equipe Técnica
Charles Silva de Araujo
Geógrafo - Geomensor - UFAM/PUC - MINAS
Analista de Geoprocessamento, SIG e Aerofotogrametria
CREA - 19430 AMRN. 041143770-4
Esp. Geoprocessamento - PUC - MINAS
Esp. Georreferenciamento de Imóveis - PUC - GO
Esp. E. Ambiental - FSDB
Analista em Aerofotogrametria e SIG.
Piloto de ARP. Associação Brasileira de Drone.Mat.: 2282
CHARLES SILVA DE ARAÚJO